
RethinkX believes that within 10 years of widespread approval of autonomous vehicles, the vast majority of the population will give up individual ownership of vehicles for transportation as a service, provided by on-demand electric autonomous vehicles owned and operated by fleets.
One of the most frequent questions we have faced is around the number vehicles in the TaaS fleet that we forecast and its ability to meet demand for trips during rush hours. The common question is, if the vehicle fleet declines from 250m to 44m, how on earth do we meet demand during peak hours? When everyone wants to go to school or work at the same time, how, with such a dramatic reduction to the number of vehicles in the fleet, will there be enough cars to transport them?
This is a very valid point and requires an understanding of how many of the 250m vehicles in the fleet are currently on the road at any one time, the buffer required to meet this demand and the ability to smooth that demand through demand management. The question largely springs from misconceptions about the spread of vehicle trips throughout the day.
-
Commutes are only 18% of total trips (including other forms of transport) or 28% of total vehicle miles traveled, which is a surprisingly low figure. Personal trips by car including errands make up a far greater proportion of total trips (29%).
-
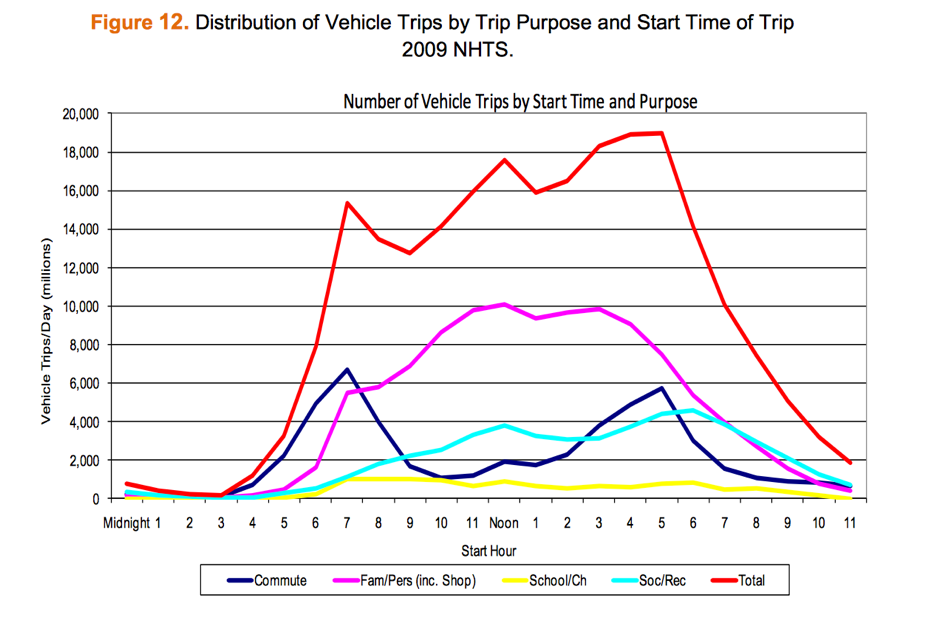
Journeys are far more spread out through the day than generally realized. The graph below from the U.S. Department of Transportation shows the spread of trips by hour during the day and is the best approximation we have found for vehicles in operation at the same time.
-
It feels like there are far more cars on the road during peak hours than at other times because during peak commute times vehicles are generally going in the same direction – from residential to commercial areas and vice versa. Most of the traffic is moving in the same direction, whereas at other times a day there is a more even 2-way flow.
But despite the smaller-than-expected number trips occurring at peak hours, this is a genuine concern, with a few options for mitigation.
1. Demand based pricing.
Surge pricing (as Uber calls it) can help to smooth peak hour demand. Raising prices in periods of peak demand can help to alleviate pressure on the fleet and spread out demand. It can also help drive users from the single user TaaS model to the TaaS Pool model. Research by Uber about the price elasticity of demand in surge pricing shows that demand is highly responsive to price increases. This doesn’t have to have the effect of raising average prices of TaaS – in a competitive market these increased revenues during peak hours will be largely passed onto consumers in the form of lower prices in off-peak times.
2. Ability to work while commuting.
Some aspects of jobs that can be done during commutes will allow people to travel at non-peak times. Many jobs by the 2020s will have elements that can be done remotely. Freed from the need to drive, people can be more flexible about when they commute to and from their place of work, hence the ability to travel when demand is lower and travel speeds faster, which can allow demand based pricing to have a greater impact on smoothing periods of peak demand.
3. Seat capacity.
We think in terms of seat capacity not vehicle capacity. The TaaS fleet will likely eventually blend with bus fleets, with vehicles ranging in size from 4-seaters through to 40+ seats. Within the TaaS Pool model there will be the ability to increase vehicle occupancy to soak up demand during peak periods. Our model sees an increase in passengers per vehicle as TaaS Pool plays an increasingly important role in mobility, meaning fewer vehicles are required to service the same number of passenger miles.
4. Systemic disruptions.
New communications technologies such as VR may allow an increase in remote working or socializing, which could contribute to a reduction in peak hour congestion. As autonomous vehicle share increases, parking spaces and other land in cities will be available for other uses. It is possible that as cities become more liveable that walking or cycling increases and the distribution of residential areas shifts.
Our model sees passenger miles increasing by 50% by 2030 with vehicle miles remaining nearly constant (due to increasing TaaS Pool use). Much of the increase in passenger miles comes from people currently excluded from private vehicle transport (the elderly, disabled and those on lower incomes). This demand is likely to be more price sensitive and lead to greater increases in TaaS Pool demand. Furthermore, demand-based pricing during peak hours might lead to movement from TaaS to TaaS Pool, increasing passengers per vehicle and seat occupancy.
A study from the ITF shows that a fully autonomous fleet could meet demand at all times with only 3% of the vehicle fleet in Lisbon, Portugal. Our model sees just over 11% – a more conservative figure. Part of this difference is because the ITF sees vehicle miles dropping by 37% as passengers per vehicle rise (due to an increase in ride-sharing – TaaS Pool). Lisbon is also denser than most American cities, meaning fewer redundant trips. Other differences that explain the difference are because we allow for lower utilization. There is a growing body of academic research (for example here and here) that has modeled the potential reduction in vehicle numbers due to TaaS, with figures largely falling between 5 and 11 vehicles taken out of the fleet for every TaaS vehicle. Our model equates to 8.6 to 1 (232m individual vehicles replaced by 26m TaaS vehicles). However these estimate tend not to include any smoothing of peak demand through demand-based pricing, which could increase these figures.
Related to this is a discussion of vehicle redundancy – how many unoccupied miles will be covered by TaaS vehicles. This is important because whilst they are repositioning after trips in readiness for the next trip, they are unused, and the miles covered generate no revenue (whilst depleting the vehicle lifetime). Again there is some research suggesting a figure of 3-14%, once AI is used for predictive demand management. This is an area that requires more research and we will look to deepen in future analyses.
Final note:
Our analysis is a scenario, subject to a large number of assumptions. No scenario will ever be completely accurate. There are many aspects that might make our analysis incorrect that stem from unforeseen regulatory responses, through to the ability of technology providers to create monopoly pricing situations (we assume competitive markets). Work and leisure could be disrupted through VR and other communications technologies that affect travel patterns, a low-cost transport platform could disrupt logistics or lead to a huge increase in deliveries of goods by TaaS vehicles, replacing some personal trips but increasing delivery travel, etc. What our analysis ultimately shows is that mainstream analysis needs to consider the potential of a TaaS disruption in more detail and adjust many of their assumptions to reflect those areas where our analysis highlights alternative possibilities.